Pertama-tama, download jpgraph disini.
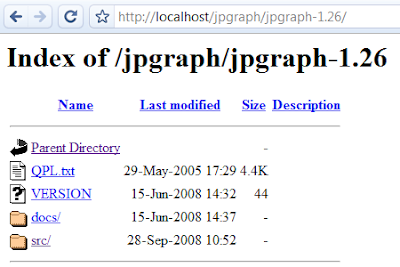
Kemudian extract satu folder tersebut ke folder www/htdocs Apache server Anda, dan langsung buka seperti misalnya dengan alamat ini :
Navigasi terus sampai ke folder Examples, dan buka file testsuit.php
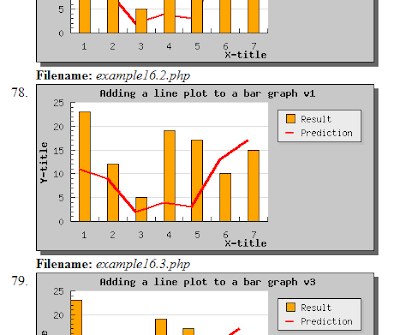
Nah, dari semua examples yang ditampilkan, perhatikan nama filenya, dan buka untuk melihat kodenya. Misalnya ini,
Yaitu grafik yang merupakan kombinasi antar grafik Bar dan Line. Nah, itu berarti saya tinggal membuka file example16.3.php, berikut ini :
include ("../jpgraph.php");
include ("../jpgraph_line.php");
include ("../jpgraph_bar.php");
$l1datay = array(11,9,2,4,3,13,17);
$l2datay = array(23,12,5,19,17,10,15);
$datax=array("Jan","Feb","Mar","Apr","May");
// Create the graph.
$graph = new Graph(400,200,"auto");
$graph->SetScale("textlin");
$graph->img->SetMargin(40,130,20,40);
$graph->SetShadow();
// Create the linear error plot
$l1plot=new LinePlot($l1datay);
$l1plot->SetColor("red");
$l1plot->SetWeight(2);
$l1plot->SetLegend("Prediction");
// Create the bar plot
$bplot = new BarPlot($l2datay);
$bplot->SetFillColor("orange");
$bplot->SetLegend("Result");
// Add the plots to t'he graph
$graph->Add($bplot);
$graph->Add($l1plot);
$graph->title->Set("Adding a line plot to a bar graph v1");
$graph->xaxis->title->Set("X-title");
$graph->yaxis->title->Set("Y-title");
$graph->title->SetFont(FF_FONT1,FS_BOLD);
$graph->yaxis->title->SetFont(FF_FONT1,FS_BOLD);
$graph->xaxis->title->SetFont(FF_FONT1,FS_BOLD);
//$graph->xaxis->SetTickLabels($datax);
//$graph->xaxis->SetTextTickInterval(2);
// Display the graph
$graph->Stroke();
?>
Dan, berdasarkan kode di atas, berarti saya hanya harus memodifikasi pada baris kode berikut :
$l1datay = array(11,9,2,4,3,13,17);
$l2datay = array(23,12,5,19,17,10,15);
$datax=array("Jan","Feb","Mar","Apr","May");
Dan itu pasti memudahkan pekerjaan saya... ^_^
Semoga bermanfaat!!!
Anda sedang membaca artikel tentang Membuat Grafik di PHP dengan JPGRAPH dan anda bisa menemukan artikel Membuat Grafik di PHP dengan JPGRAPH ini dengan url http://wanzbsc.blogspot.com/2011/12/membuat-grafik-di-php-dengan-jpgraph.html. Anda boleh menyebarluaskan atau mengcopy artikel Membuat Grafik di PHP dengan JPGRAPH ini jika memang bermanfaat bagi anda atau teman-teman anda,namun jangan lupa untuk mencantumkan link sumbernya.


{ 0 komentar... read them below or add one }
Posting Komentar